What is my research project about? Part 5
It has been a while since I updated what I am currently working on. Well, the biggest update has been that I finally finished my final field campaign on Angel Island which means I have all the data (rock measurements) and my rock samples to push my project further. After any fieldwork campaign ends, there is a lot of administrative tasks that needs to be sorted first before we start unpacking all the science. In this post, I will try to give a brief glimpse into the process of arranging all our collected data and turning our rock samples into glass slide sections so that we can study them microscopically.
While we conduct our fieldwork, we use several hand-held digital and analog instruments that helps us collect our data. We use a brunton compass to measure the angles at which the rocks and the outcrops are oriented. We use our notebooks and pens and pencils to write down our observations and draw some sketches. We use our GPS devices to get coordinates of where we are. And of course, we use our hammers and chisels and sample bags to collect our rock samples. In my 6 week long field campaign, we collected a lot of samples (190lb to be precise) and a lot of data!
Having all these information spread out across notebooks and maps and images is no good since we cannot visualize any trends or systematically analyze them to see what broader information they are hiding. So the first step after finishing up fieldwork, is to arrange all our data points into spreadsheets. This data entry task can feel tedious but is extremely crucial for all the following steps. In our spreadsheets, we input entry fields like coordinates of the locality, measurements of the outcrop, quick keyword description of the rocks that we see, notes about samples taken and/or images taken. The idea behind this spreadsheet is to provide you with a snapshot of information for a given locality. Once this spreadsheet is done and dusted, it forms the major dataset that we input into geographic information system (GIS) system softwares like ArcGIS or QGIS. These softwares allow us to build our maps and transform all the notes we made in our notebooks to a visually appealing and informative map of the area. I will try to make a later post about how this happens.
While we are working on building our spreadsheet and designing our map of the area, we also have to unpack all the rock samples we collected during fieldwork. Since we do these two steps simultaneously, it becomes easier to tag our samples to its geographical location and add extra information about some features we see in the collected sample. Once all the rocks have been unpacked, the next step is to figure out how to cut it.
As a structural geologist, our primary reason for cutting open a rock is to understand the internal structures of the sample (and by extension, the outcrop). How these structures are oriented in space is also important since it tells us about how these rocks got squished and smushed and well, deformed. We tend to cut our rocks in a direction called the sense of shear plane. Sense of shear plane is a plane cut through the rock that tells us the maximum amount of information about the deformation history of the rock. Imagine a tall heavily frosted cake. From the outside, it looks quite plain. Now if you cut vertically through it, you will be able to see the layers of this beautiful cake and understand what the fillings are, how thick the layers are, or if the layers have any hidden surprises like sprinkles. Now, if you had cut the rock horizontally, you will see only one layer of the cake, maybe with some bits of frosting attached to it. Your ability to appreciate the beauty of the cake will be limited since you can only see one layer at a time. Now we can translate this analogy to the rock. We want to cut into it in a way that shows the maximum features and structures. Since I work with deformed rocks that have been sheared or faulted, I want to look at the profile that tells me how or which way the rock fractured and slipped past each other, hence it is called the sense of shear plane or the plane that tells us about the direction of fault movement.
For us to determine this plane in a lump of rock, our collected field data comes in handy. With all the field information we gathered, we can re-create how this rock sample was oriented in a 3-dimensional (3D) space. Whether it was horizontal or inclined. Was it inclined to the NW or the SE? Which way were the layers inclined in the outcrop? Which way are the layers oriented in the sample? Once we have captured the orientation of the rock in a 3D space, we get our rock saw ready and get cutting. The rock saw we use is a diamond impregnated circular saw automated blade. Since its job is to cut through rocks, it can get quite heated and send of sparks. To counter these sparks and ensure that our lab does not catch fire, we use water jets to cool the blade down as we cut the rocks. For safety, we also wear protective personal equipements (PPE) to protect our eyes, ears and hands. We also wear masks so that we avoid inhaling rock dust. To make the cut, we place our rock on a sliding tray, grip it as hard as possible, start the blade and the water jets, and slowly (very slowly) we inch the rock closer to the blade and hold it in place while the blade does its magic. Because most of my rocks are crumbly and fractured, I have to do an extra step before I can put it through the saw. Usually we use an epoxy resin mixture to seal in the fractures and all the crumbly bits so that the rock does not fall apart when it comes in contact with the saw. Once the rock looks put together, we saw!
We cut the rock in a plane that is perpendicular to the layers in the sample. This reveals to us the sense of shear plane where we can see all the layers, its fillings, if the layers are straight or wavy and other such information. But the rock cutting process is not done yet.
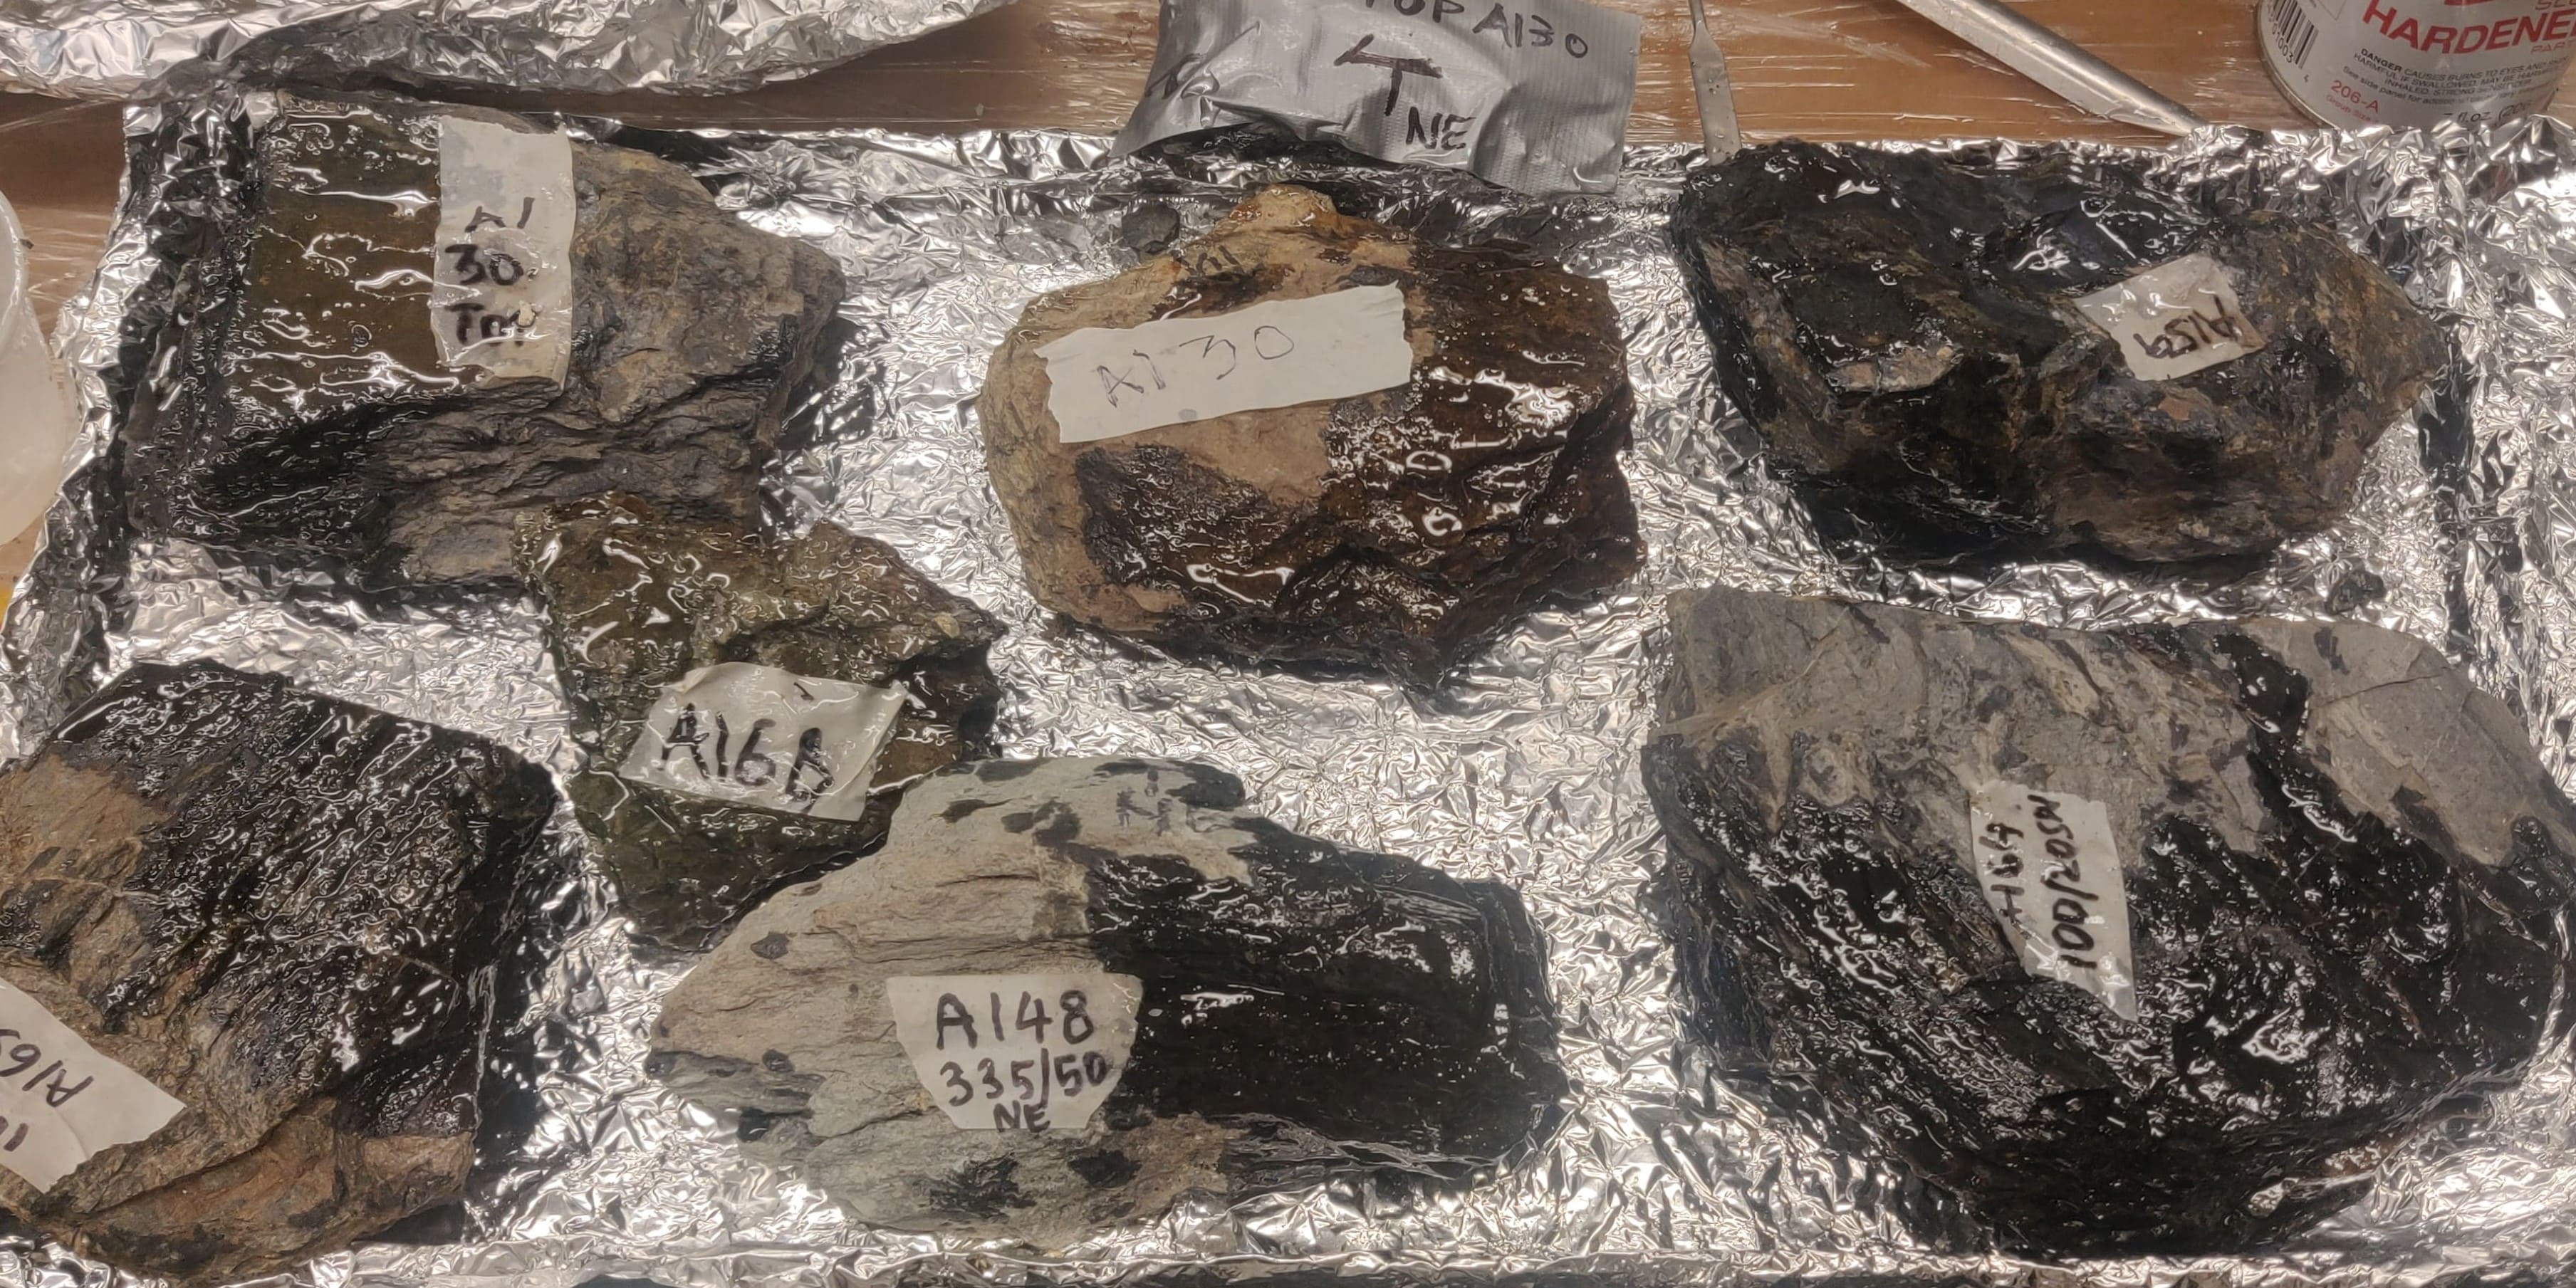 Samples with the shiny coat of epoxy to hold them all together.
A cut rock is still too big to be fit under a microscope lens. We need to trim down this cut plane of rock to a size that will fit on a glass slide that will in turn, fit under the microscope. So back to the saw we go. We gradually cut down the edges, and other extra bits to make sure that our rock chip has a cross section of approximately 25X45mm. We keep doing this till we have all our rocks cut in the right way and of the right size. Following this step, we send them away to petrographic preparation service companies who will turn these rock chips to very very thin (0.03mm to be precise) rock sections that are mounted on glass slides. While we send them away, we also provide a list of instructions to the company about which side needs to stick on to the glass slide, if it needs special care, polished or unpolished, etc. The service provider will smooth out all our rock chips and ensure that the surfaces are no longer bumpy before mounting. To mount the chips onto the glass slide, we use resin/epoxy to secure the sample to the slide. Then slowly but surely, the side of the rock that is not sticking to the glass is gradually ground away using gritty powders and polishing turntables so that finally we have a very thin rock section that can allow light to pass through it. And with this, we have finally completed the process of turning a rock sample into a rock thin section. In the next post, I will post some pictures about how these rock thin sections look under the microscope!
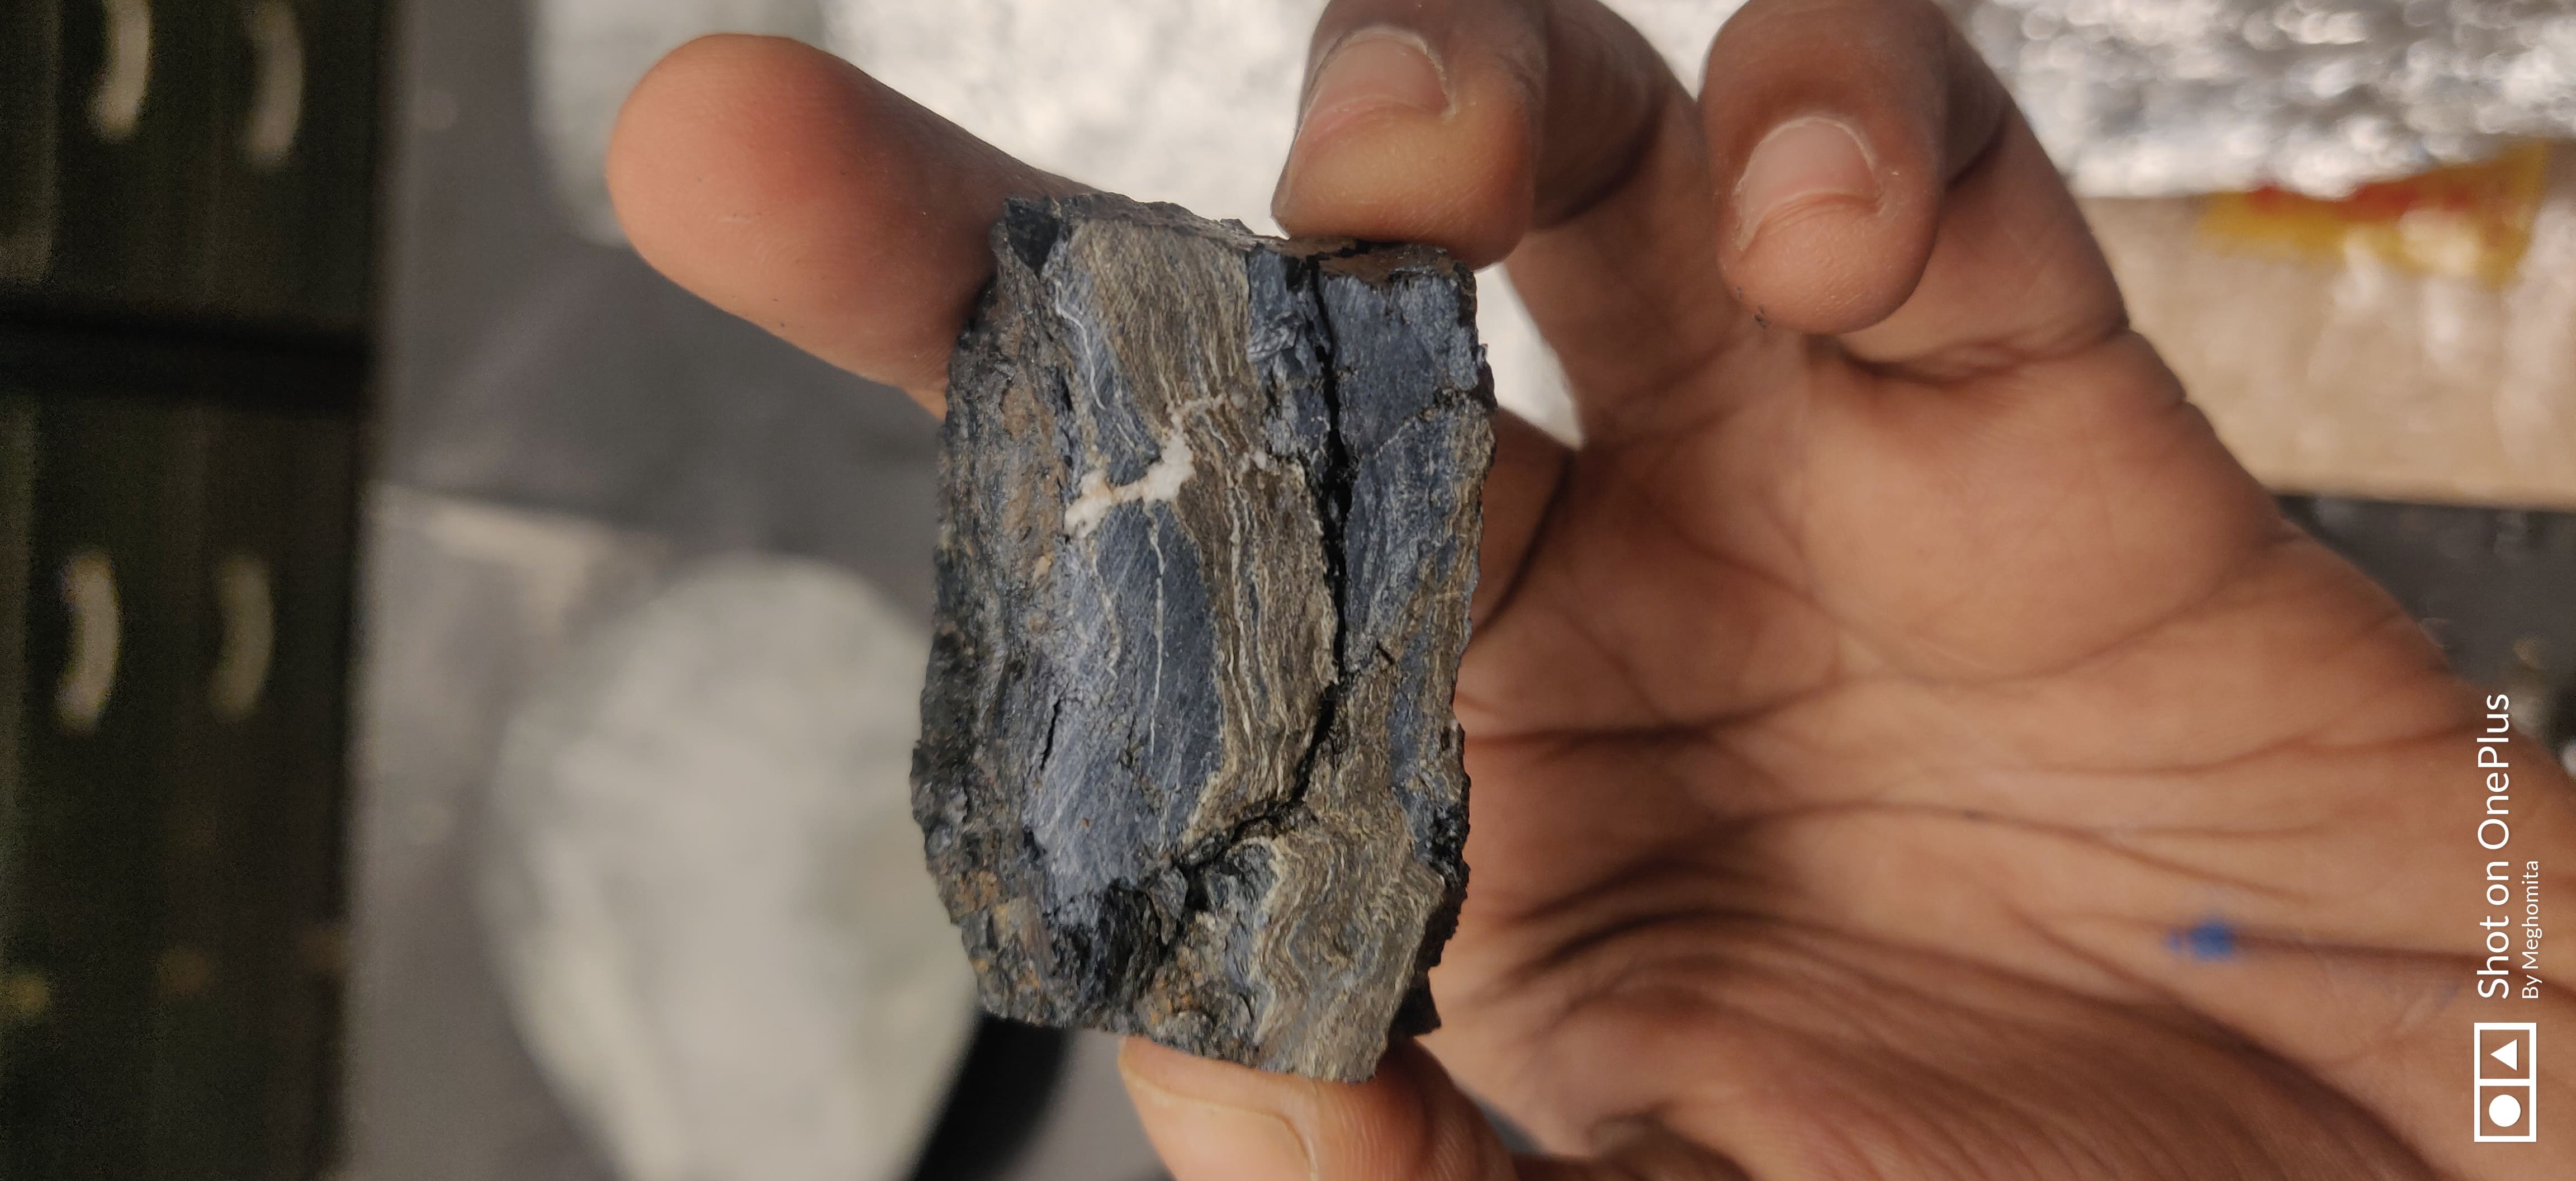
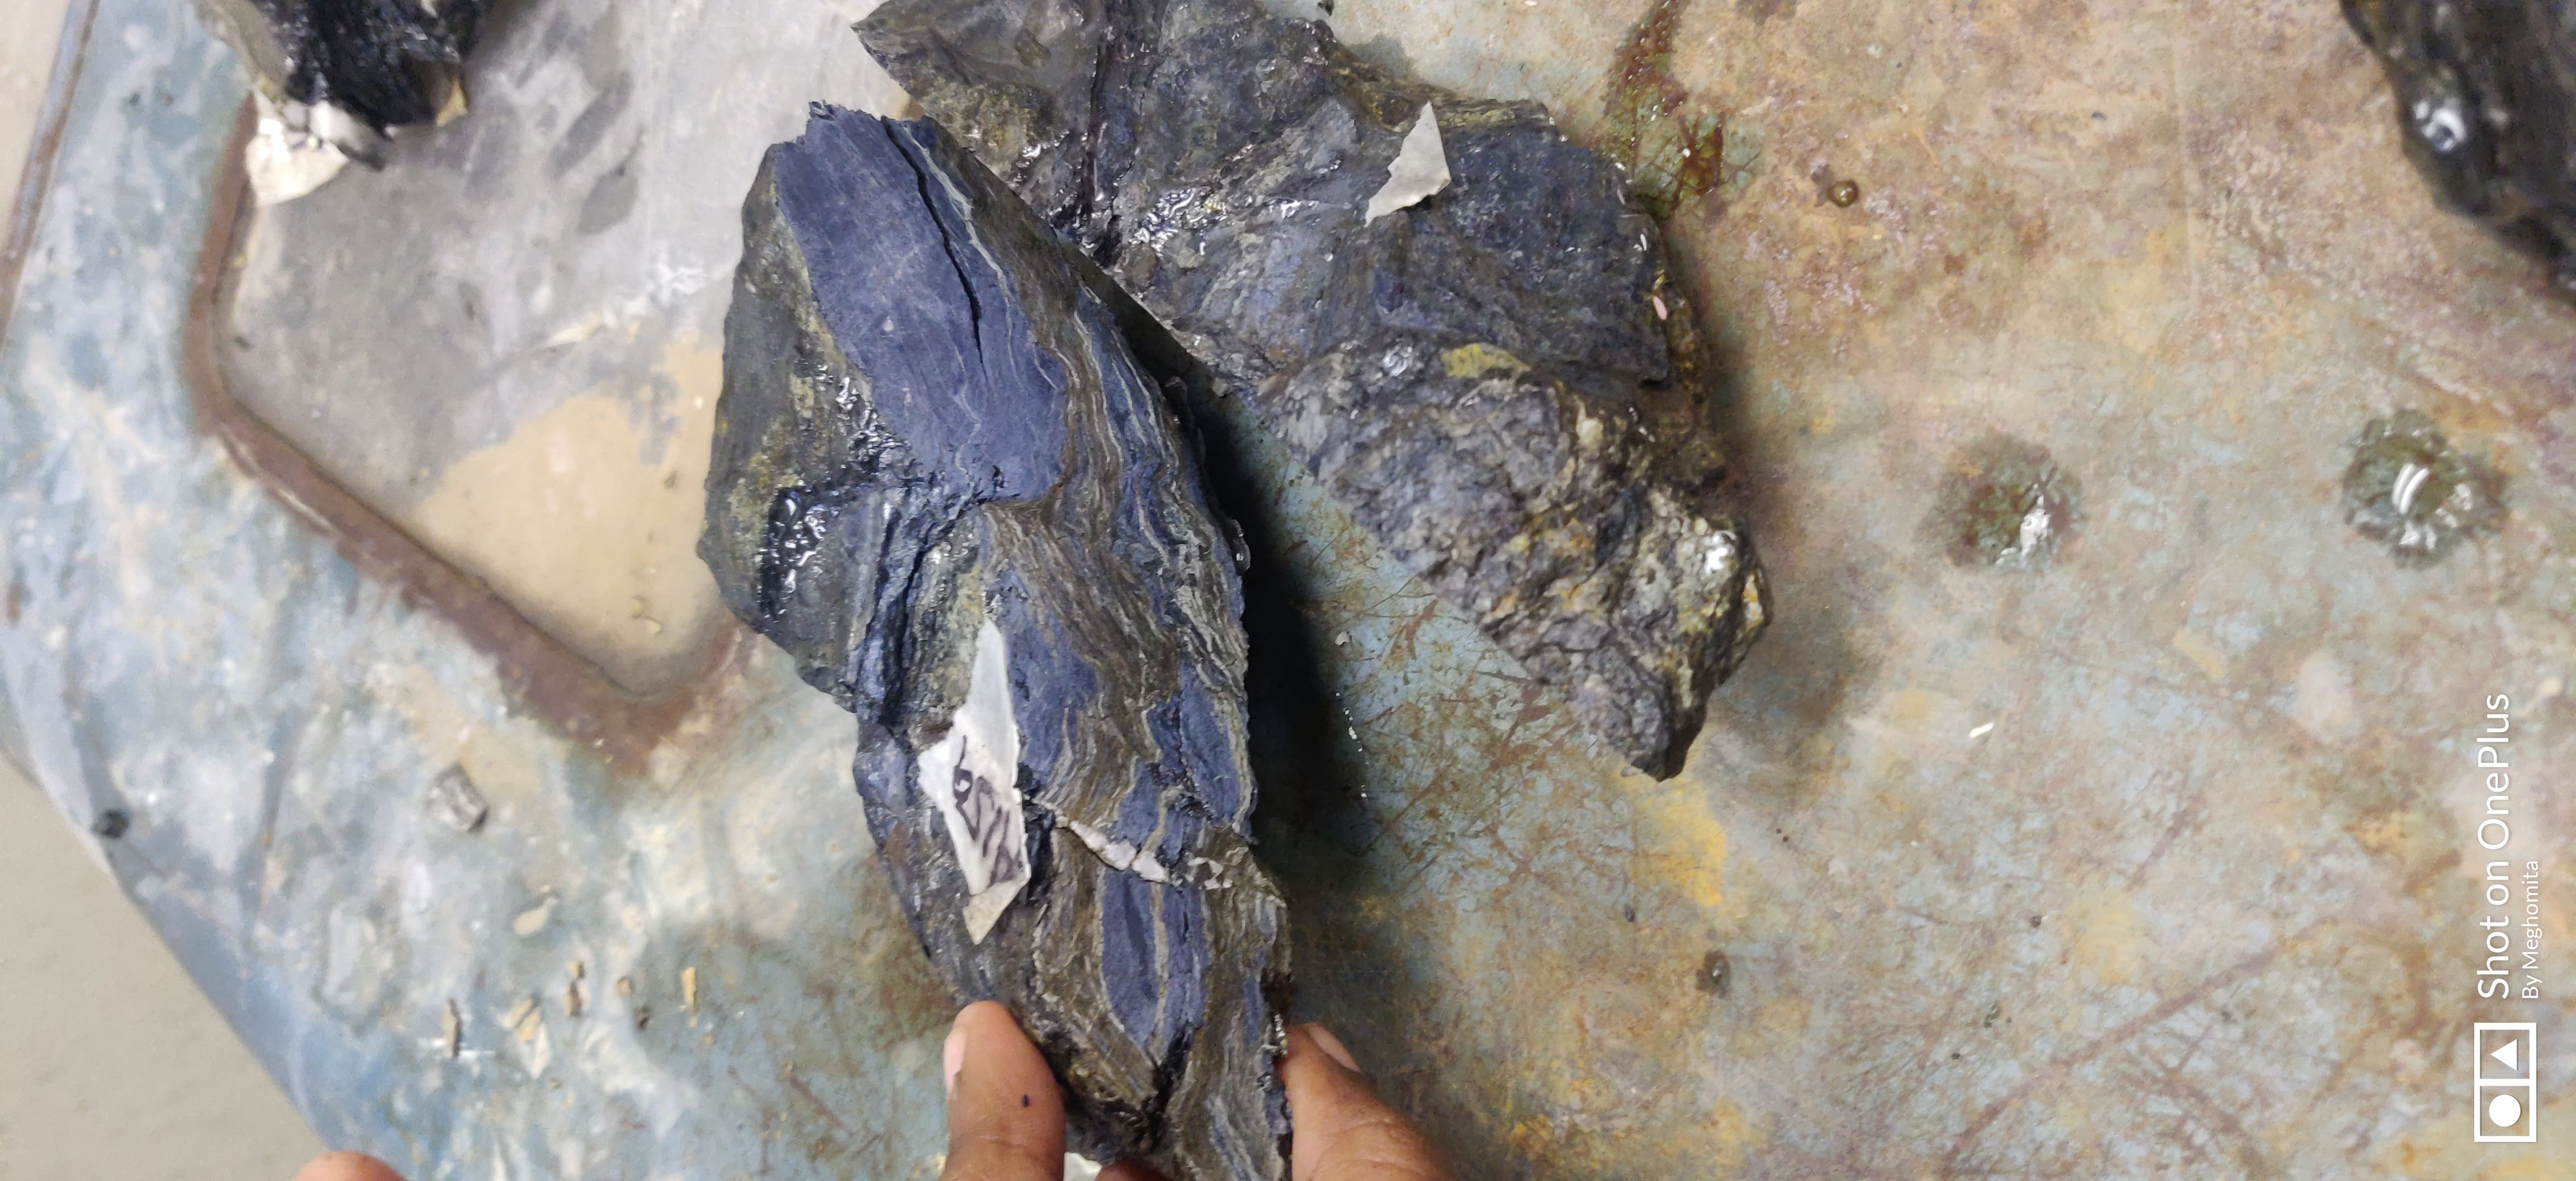 Once the rocks are sliced and trimmed, this is what it looks like. These are the surfaces with the maximum features.